The ‘Right Click Authenticate’ button is an innovative yet simple idea to combat the spread and propagation of misinformation online and social media. Simulations of the ‘Right click Authenticate’ approach have proven to cut down the spread of misinformation to the source and hardcore distributors of misinformation. The problem of sharing misinformation is not so dissimilar to how endemic viruses are reported to have been in the 90’s until anti-viruses came about to successfully purging their spread. Through our research, we believe that the ‘anti-misinformation’ solution is needed and ‘Right Click Authenticate’ button is the possible answer. Check our conceptualization section to test the approach before and after. In the after option, right click or tap the image to see how our allows you to learn more about the source of the image with an editorial that provides you quick and easy ability to decide if this piece of news is fake, true, or unverified. You can then read about our research and what we have found out from our simulations.
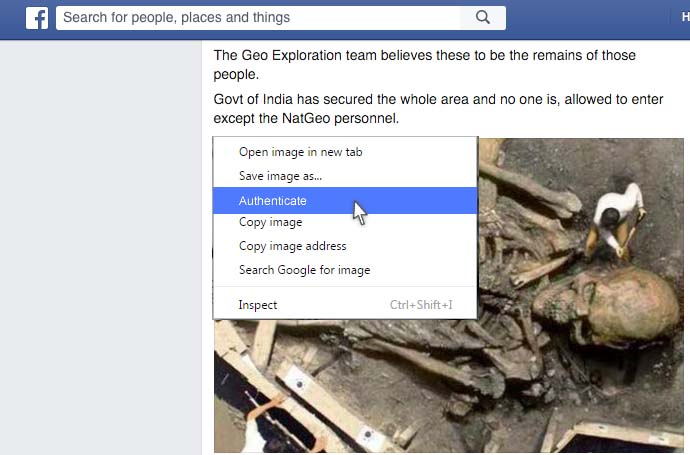
The team discovered that much of the tools that can be used to review, rank, and identify misinformation are already found online but may have not been used combined together in a format that would help users in their quest for authentication check. The authors proposed a conceptualization of a quick and easy process that could be used to combat misinformation online. It should and could start with a right-click ‘Authenticate’ option as shown in Fig.1. Fig. 1. Conceptualizing a right-click 'Authenticate' option
A. Images checks.
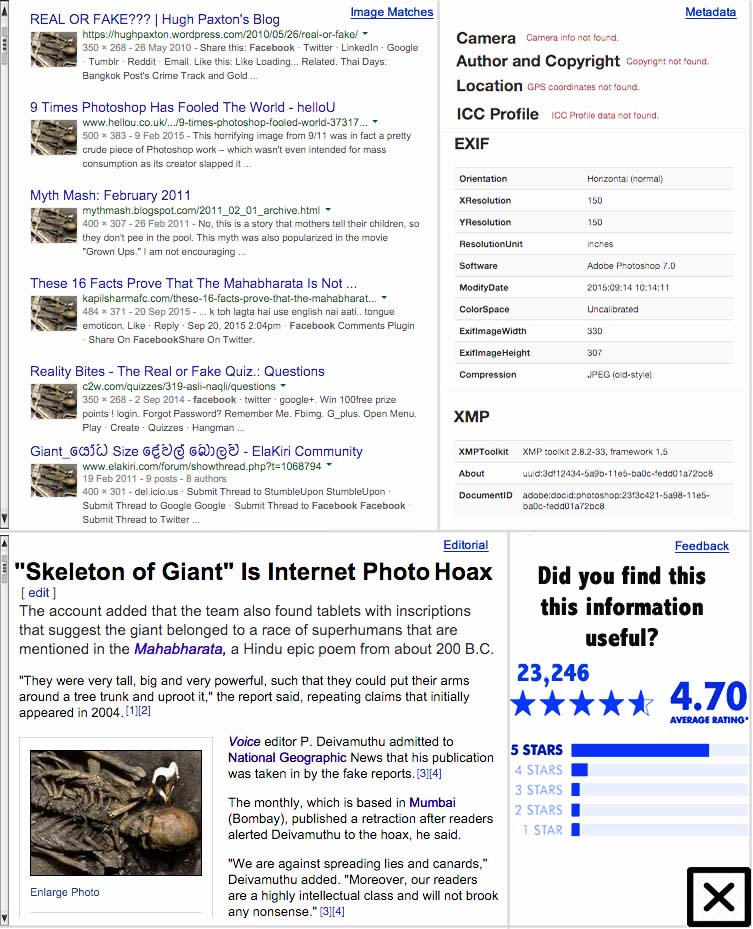
Reverse image search using Google Images, available via Chrome desktop browser as an add-on, is one tool that is underutilized. This is a completely different search engine to Google image keyword search that returns images based on the web user keywords using their standard search page. This search requires user to upload an image or copy the image’s web address to search for matches to that actual image online. The results reveal the sources and dates of the first appearances of that image online and content which appeared with that image. The Google Images search is refined to detect even modifications of the image including color tones changes, cropping, and writing, yet still be able to link it to the original image. Finding the earliest sources of an image is the first step to validating the image origin or the stories associated with it. Second layer is to validate any meta-data linked with the questioned image. Original, image metadata could reveal the device that was used to take the image, the creation date, what changes and on which parts of the image these meta-changes have taken place. Meta-data may also help detect if any image editing tools have been used. Finally, an editorial feedback in a similar format to how Wikipedia operates authentication of information, could be linked to an image. Image editorial feedback maybe combined with explanation based on the origin, date, meta-data, where it appears online, or article that dismisses or confirms that image. Finally a crowdsourcing of feedback could be added as final confirmation. These four sections could be identified as: Image Match, Image Metadata, Editorial, and Feedback respectively. The solution would be to bundle these four sections into one single right click option, see Figure 6. Fig. 6. Conceptualization of the 'Authenticate' outcome as a separate page
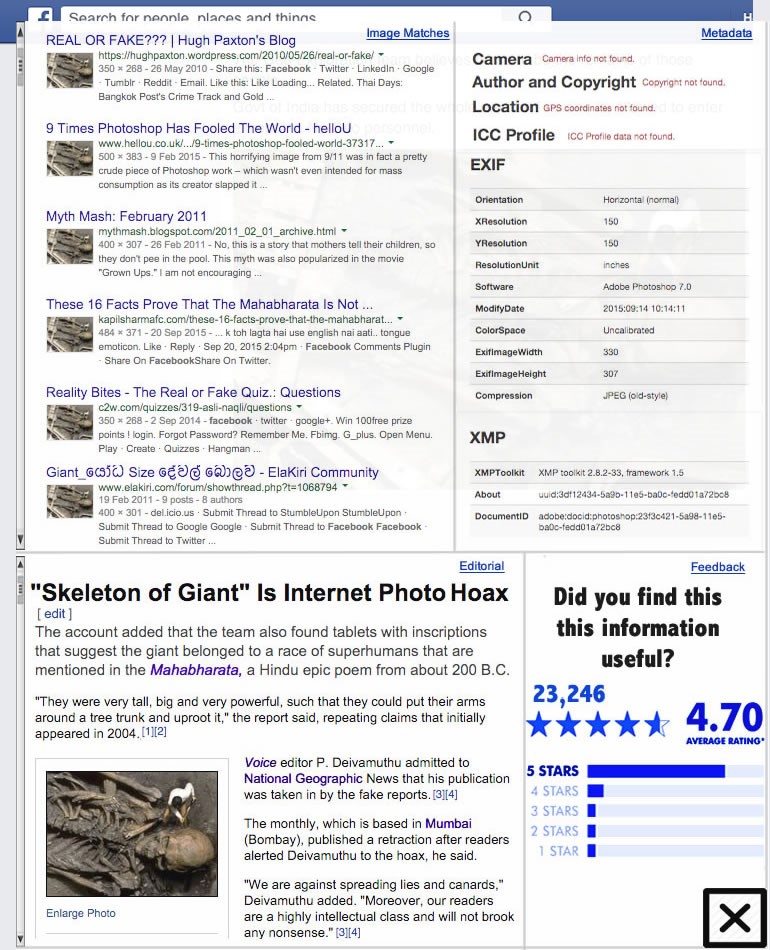
So the right-click ‘Authenticate’ option would perform an image search to display early appearances, dates, and early text linked to the image; Display meta-data that shows creation dates, editing, and originality; editorial section with references; combined with crowdsourcing of feedback from visitors. Where an image is new and the authenticity of the image remains unanswered, this would be shown too although the attention could then be focused on the image metadata. Finally, using the same algorithm used for online search engines, an image that gets frequently selected as a match would get higher ranking than those images that do not get selected as a match. To demonstrate this concept, we have provided a conceptualization images in Figure 5, Figure 6, and Figure 7 of the giant skeleton identified in the literature review. The Chrome bowser in this case would take the lead with a right click that usually allows users to perform several other options, Figure 5 can now include an ‘Authenticate’ option. The output could be shown in a new tab, Figure 6 or as a layer over the current display, Figure 7. The information shown in figures 6 and 7 is genuine with the exception of Feedback Section. In the case of the giant skeleton, the Image Match section returned Google Images results that almost immediately questioned the authenticity of the images; the Metadata section showed Adobe Photoshop 7.0 has been used on the photo with no information of camera or author; the Editorial section is taken from National Geographic but could have been easily linked to Wikipedia had it developed a section to authenticate images; and finally the Feedback section could have been the crowdsourcing of feedback allowing final confirmation on the quality of the editorial. Fig. 7. Conceptualization of the 'Authenticate' outcome as layer over a page
B. Text checks.
The option to highlight a text and search for it online is already a well-established tool on many browsers. The problem with such tools is that they only search for where the text appears and provides little or no further information on its authenticity. A right-click authenticate could select that sentence (or few sentences) and make specific online search following the criteria listed above: first appearance, origin, and editorial comments. Where there is dispute of its authenticity, this is would be clearly shown. What would make this option useful is that if it can again harness crowdsourcing to link such pieces of information to other pieces of information, which may be presented in different context or different wording. Turnitin, a tool used predominantly in academia to check the originality of students’ work is one of the tools that could be employed in this context.
The combinations of all these variables and the assumptions that the team made to understand how combating misinformation works has resulted in identifying some key variables where i is the first vertex and (jn) is the last vertex of the given simulation. (V1) represents the first phase of spread of misinformation and (l) represents the maximum possible reach of information through the network. The authors conclude that combating misinformation online is also be influenced by the following variables: rate of authentication (A), passing on information rate (P), average cross-wire rate (Cw), success rate of Same Level communication rate (Sl), and Reverse Validation rate (Rv). Thus the paper demonstrates by means of simulation how misinformation travels online. The paper also shows how ‘right-click authenticate’ process can reduce the spread of misinformation online. Thus suggesting a viable solution for combating misinformation online by identifying and demonstrating key variables and factors.
The authors outlined the steps of the experiment as follows.
For a population of 100, sharing rate of 10 and passing rate of 20%, the authors first ran the simulation assuming no validation of any sort is done on the misinformation, resulting in having the misinformation reaching the whole population of the experiment.
The experiment is run again assuming the best scenario in which one in 100 would take it upon themselves to validate the information themselves.
A series of simulations are run in which authentication button is assumed to be made accessible. Using random node selection, the authors considered the impact a 10%, 20%, and 30% of the population have access to the authentication button to validate the misinformation.
While assuming 30% of the population have access and uses the authentication button, the next simulation considers the impact of Cross-wire communication between the nodes of 20%.
Keeping the variables constant from point 4, the next simulation considers the impact of Same Level Communication rate of 20%.
Keeping the variables constant from point 5, the next simulation considers the impact of Reverse Validation rate of 50%.
Finally, the authors compared the outcomes of the two-dimensional outcome of [14] with the findings of the three-dimensional simulation of this paper.
A summary of these variables is presented in Table 1.
Table 1.Critical Variables for Combating Misinformation Online
Maximum population
(l)
Sharing
(S)
Passing on Information
(P)
Authentication
(A)
Cross wire
(Cw)
Same Level (Cluster) Communication
(Sl)
Reverse Validation
(Rv)
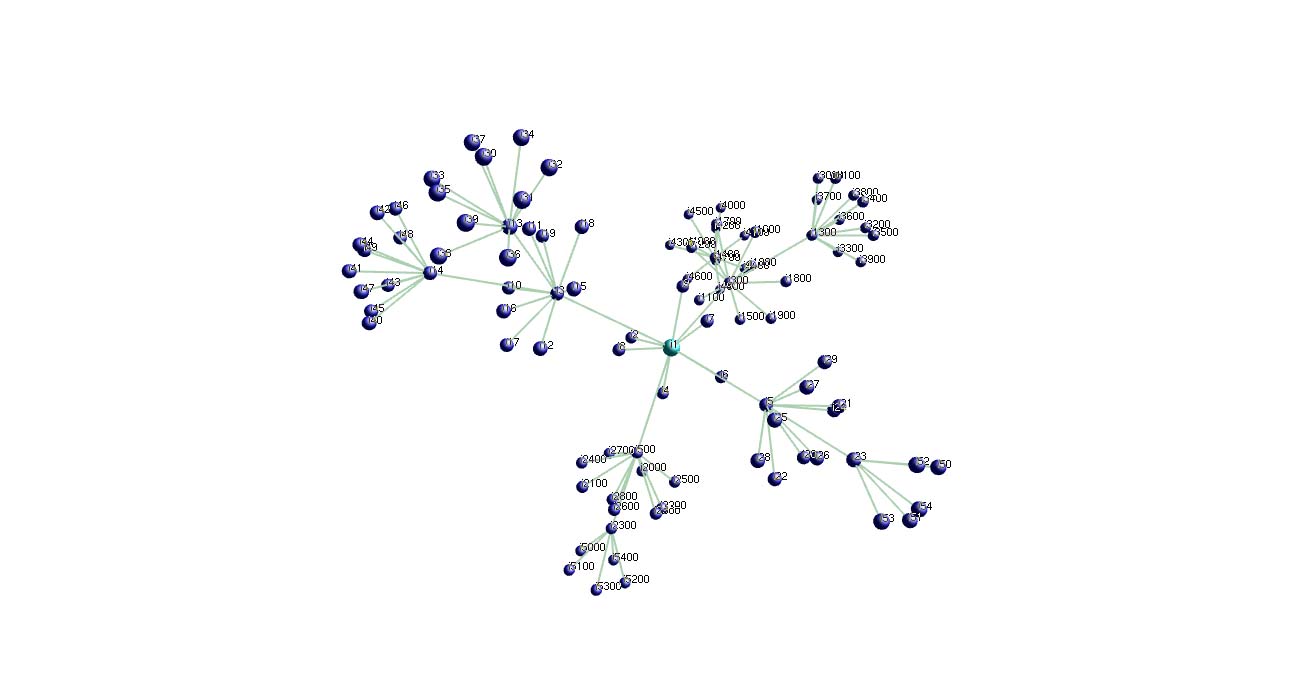
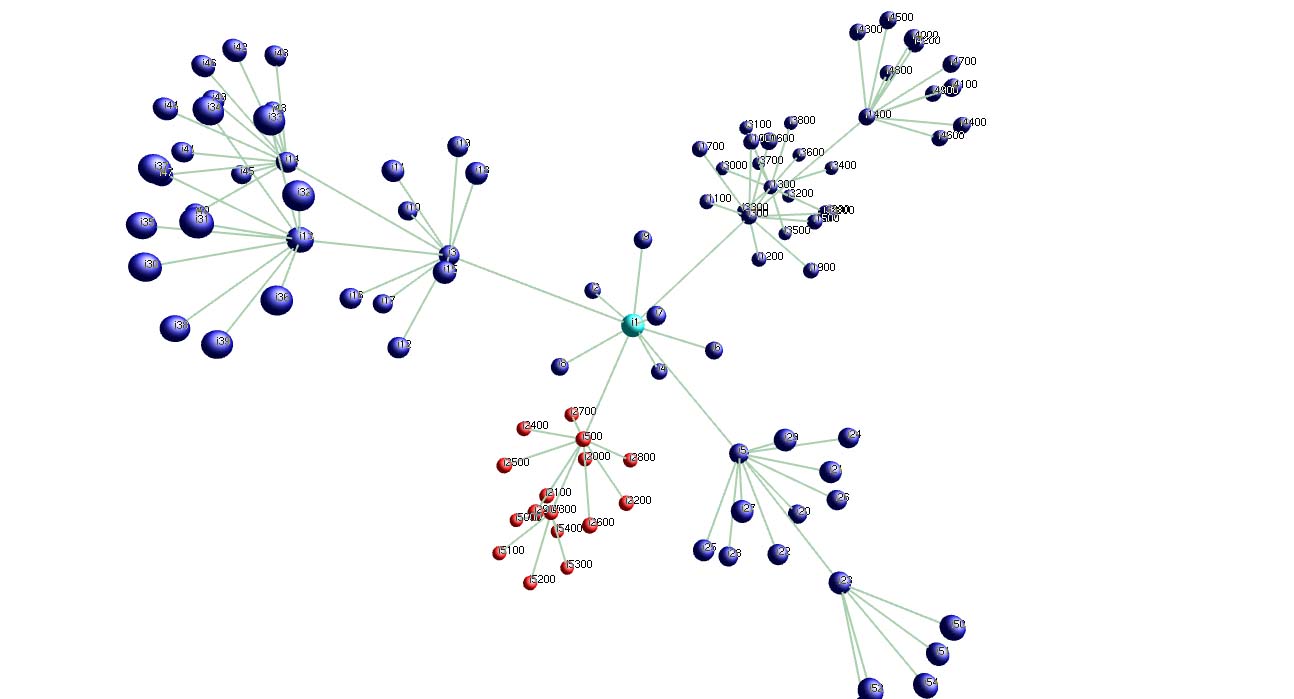
Identified variables have been applied in different percentage to simulate behavior of users in network exposed to misinformation spreading. The graph theory is used to model the network and to apply identified variables in this dynamic environment. The authors considered a weighted directed graph G = (V,E) consisting of V vertices - maximum population of users of the network and edges E which represents the connections between users. (S) is a variable that represents the maximum reach of each user. (P) is a variable that represents the rate of users who read the information and then perform an action of actively disseminate it further. (A) is a variable that represents the rate of users willing to authenticate the information. (Cw) is a variable that represents the probability that users who received different information from different sources will react to validate. (Sl) is a variable that represents the probability that the user who authenticates information and leaves feedback encourages other users from the same level also to authenticate. (Rv) represents the probability that the user who initially believed the misinformation, while being informed by other users through their feedback that the information is not true, either removes the post or rectifies the post. In the first simulation, the authors assumed that there is no authentication. The setups of variables are as follows: l = 100, S = 10 and P = 0.2. The rest of the variables are set to be 0. This scenario is representing spreading of misinformation without any effort to fight it. The result of that behavior or better no behavior at all, shows that misinformation spread reached the maximum population of 100 nodes, and eventually all users have believed the rumor as is shown in Fig. 5, where all nodes are colored in blue.
Fig. 2. P = 20% and S = 10
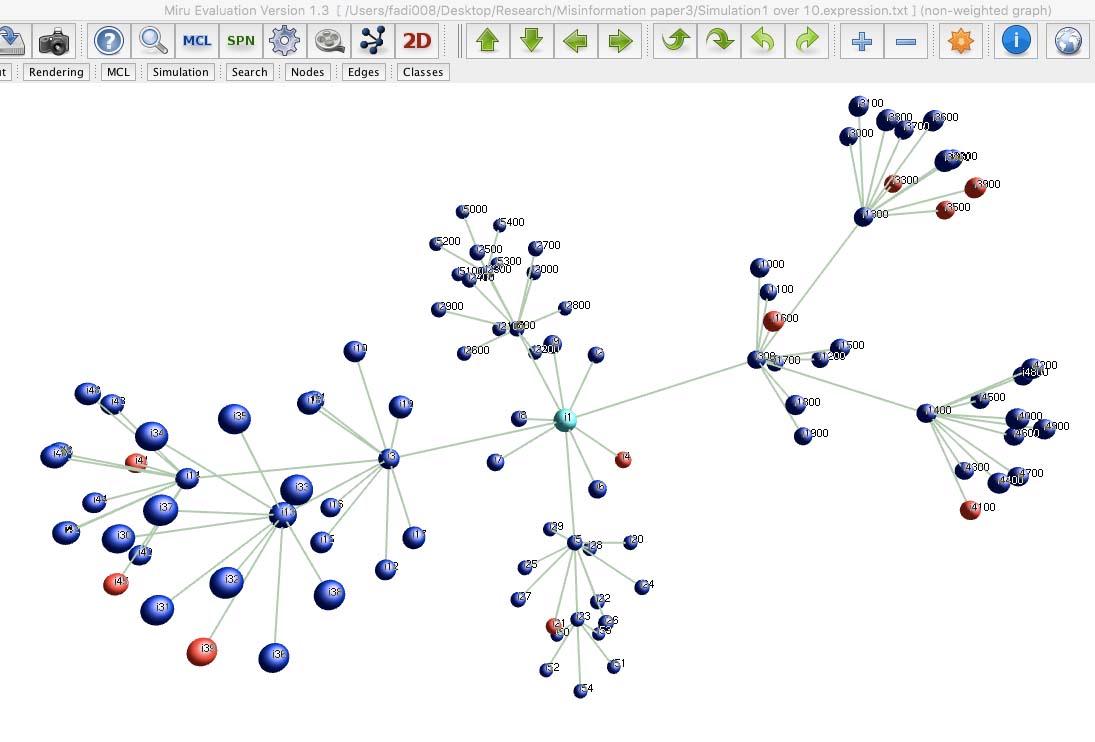
In the second scenario, the simulation demonstrates what would happen if early in the process at least one user decides to check and authenticate the information. The setup of experiment variables are as follows: l = 100, S = 10, P = 20%, A = 1%. The rest of the variables have been setup to be 0. The simulation presented in Fig.6 shows probabilistic behavior of a network. If the user who authenticates is not a user who shares, then the impact is minimal. Otherwise, if the user who authenticates is a person who shares, then the impact is maximized. In the best scenario where the self-authentication is done early on by someone who shares, 75% of users will continue to be exposed to misinformation. In any other scenario, 99% of users will continue to be exposed to misinformation.
Fig. 3. A = 1% && S = 10
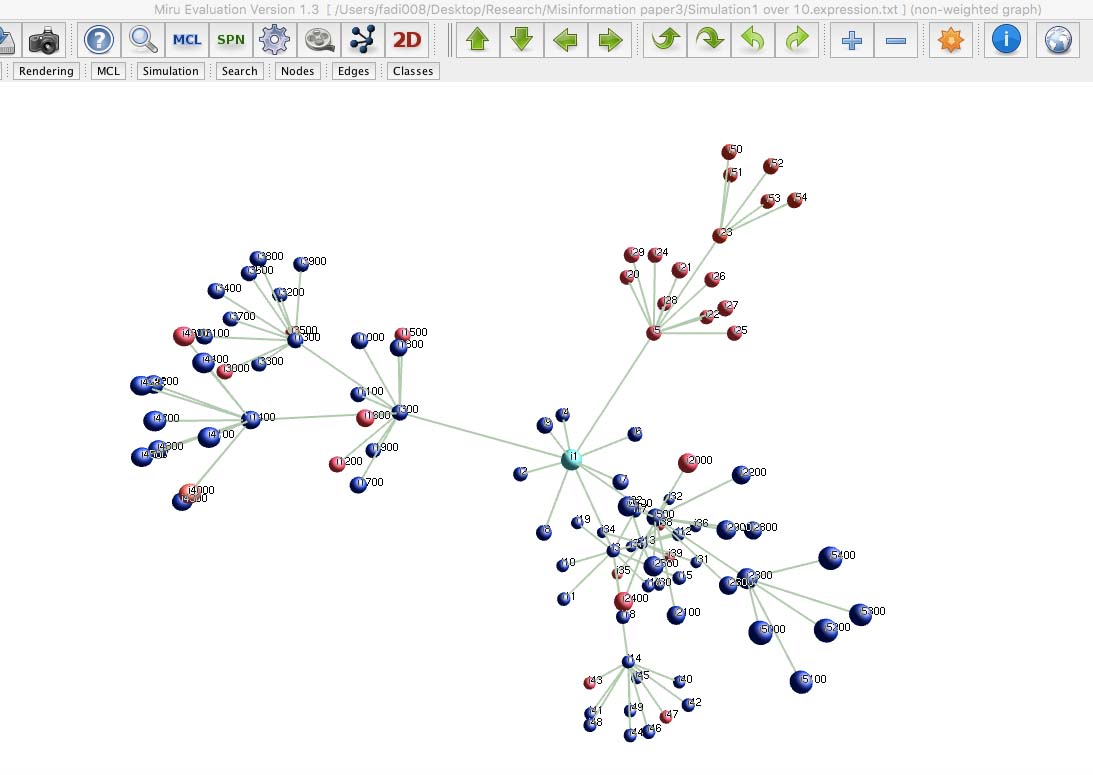
In the third simulation, the authors start to consider an authenticate button and ability to authenticate becomes more accessible. In this scenario, they assume that 30 percent of users, chosen randomly among the population, would authenticate. Furthermore, the simulation is project on the previous scenario to observe the impact as shown in Fig. 7, 8 and 9 respectively by varying A to be 10, 20 and 30 percent.
Fig. 4. A = 10% && S = 10
Fig. 5. A = 20% && S = 10
Fig. 6. A = 30% && S = 10
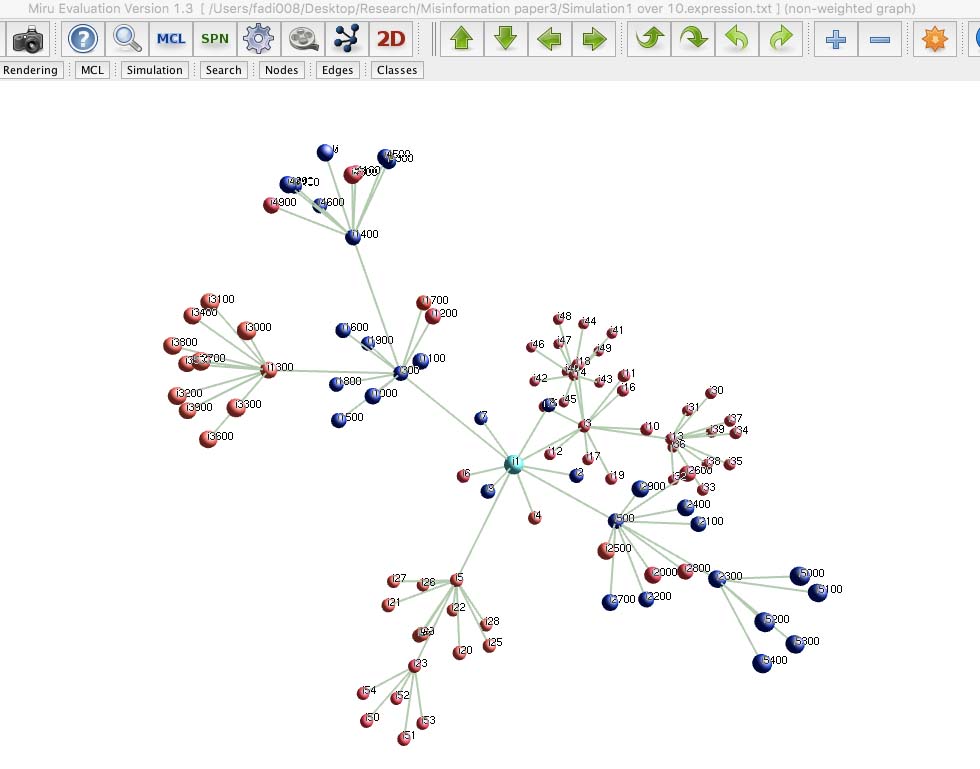
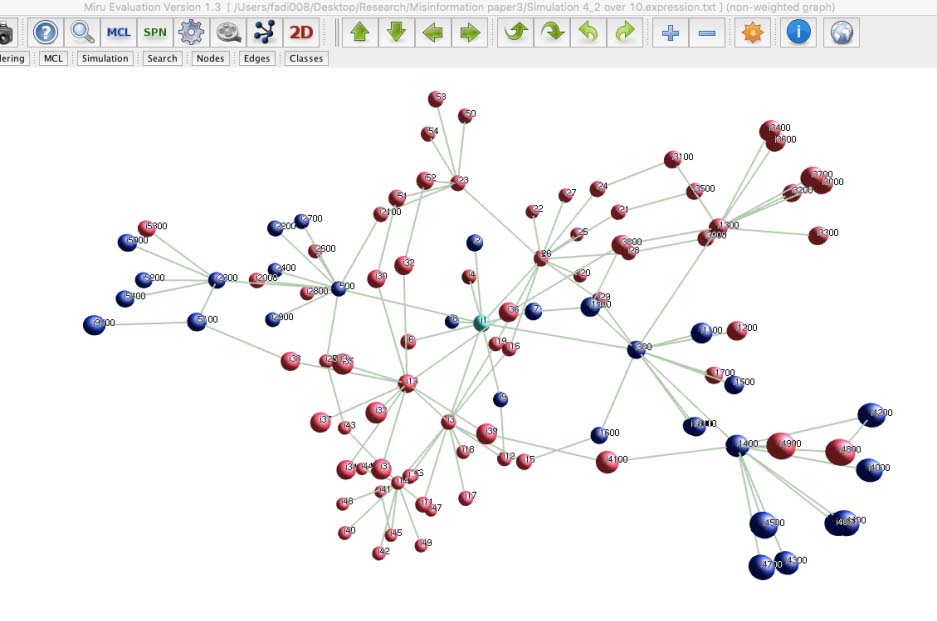
Naturally, the simulation shows that the higher percentage of people who are able to authenticate, the less misinformation travels. These can be observed in changing the color of users from blue to red meaning they stop believing in the rumor. However, the blue nodes at the extremities of the tree in fig. 9, represent some users at the extremities of the tree who still believe misinformation, which suggests that should the population exceeds 100 then misinformation is likely continue to spread. For the fourth experiment, the authors considered Cross-wire (Cw) in that a user will get the information from two sources which may include a source that happens to have validated the misinformation. In this scenario, Cw is set at 20 percent. The authors ran the simulations randomly on the previous experiments to see the impact of variable Cw, see fig. 10.
Fig. 7. Cw = 20%
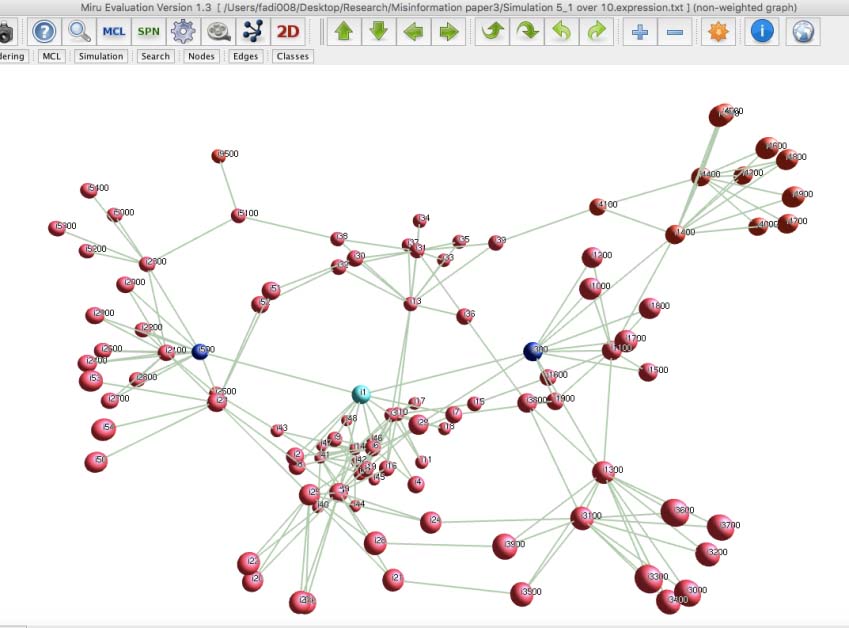
As evident from what can be seen in fig. 10, the ability of misinformation to spread has been reduced significantly. However, the simulation showed a way for the rumor to pass through. For the fifth simulation, Same Level communication Sl variable represents users who authenticates information and leave feedback therefore encouraging other users from the same cluster to authenticate. Thus, some users who will see the misinformation and validate it would take it upon themselves to let users read this misinformation and be informed that the picture or article is not true. In this scenario, Sl is set at 20 percent.
Fig. 8. Cw = 20%
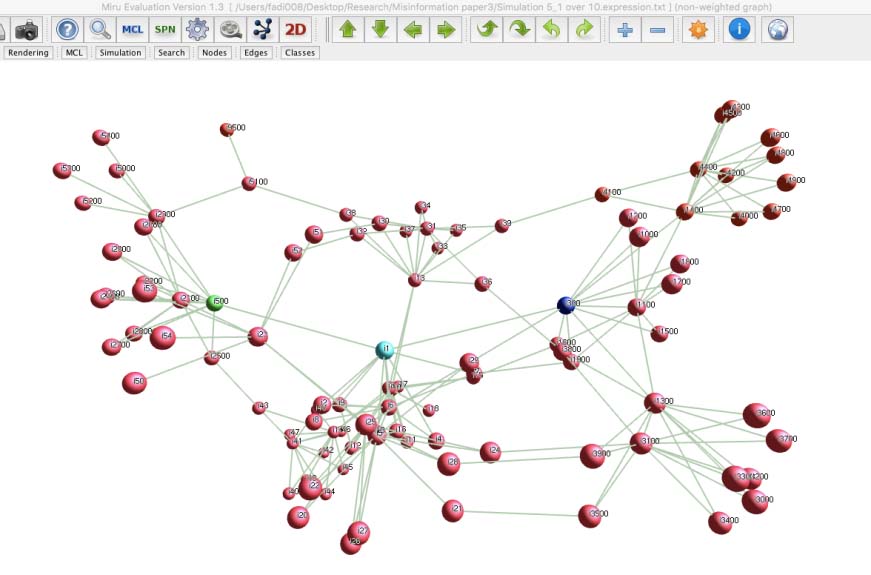
It is evidence from Fig.11 that there is near elimination of misinformation and for the first time misinformation is locked in a way that prevents it from expanding further. In a simulation of this nature, it would also suggests that in scenarios of 100+ users, the outcome of such simulations should be the same. Nevertheless, this scenario shows that there were two pockets of misinformation. In one pocket, the left blue node was left as the only user in the cluster who believes this misinformation. For the last simulation, the authors considered the impact of reverse validation (Rv). Reverse validation is when a sub-source of misinformation either reverses or removes their post after realizing it is a misinformation. This is likely to be the case where all or most of the children of the node have turned red – indicating they do not believe this misinformation. In this scenario, reverse validation (Rv) is set to take place in 50 percent of the time. The author ran a random simulation and of the last two blue users, one turned green as is shown in Fig.12.
Fig. 9. Cw = 20%
Simulations further confirmed that the number of users becomes irrelevant as the extremities of the ‘tree’ are eliminated and that misinformation will be confined to the first source and first line beyond which misinformation will not be able to travel easily.
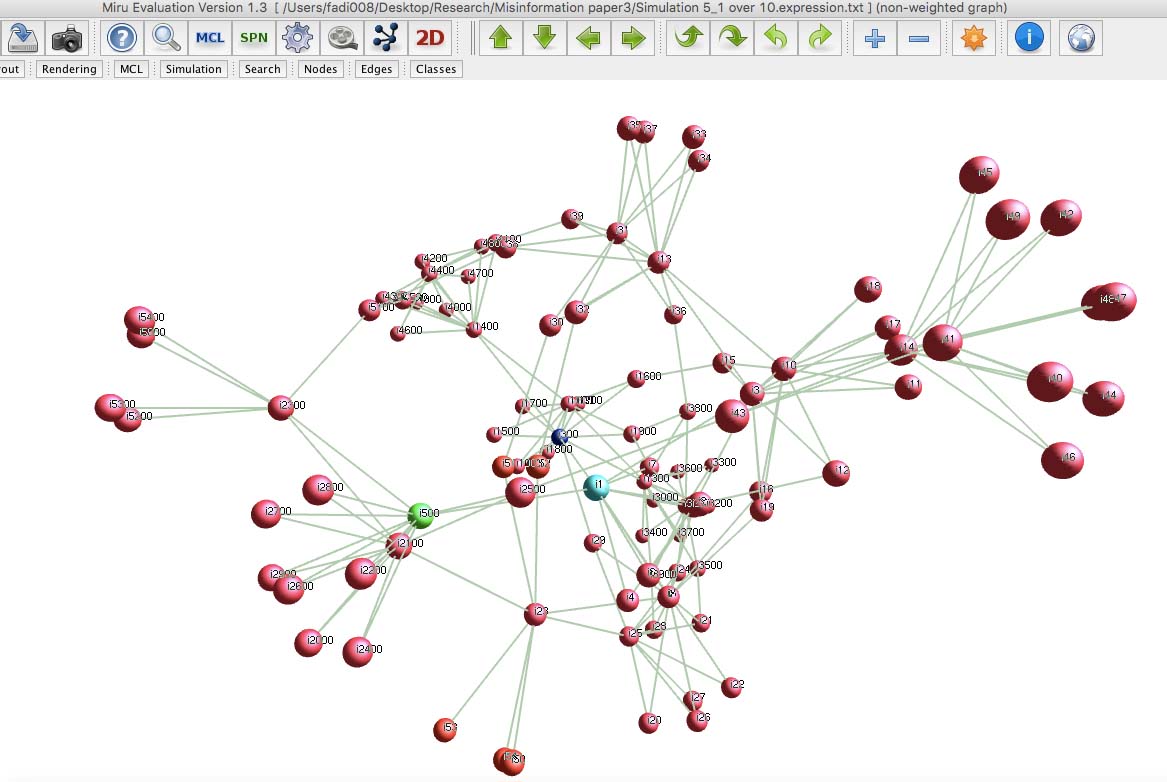
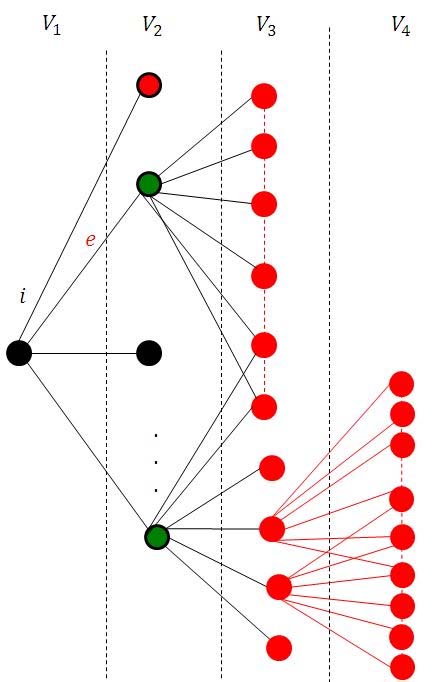
The graph analysis of both two dimensional and three dimensional simulations demonstrated that given the same variables, the outcomes of simulation will be identical as demonstrated in the fig.13 close up view. In both simulations and given the same set of variables, misinformation failed to expand beyond the second layer V2. In both simulations, misinformation cascaded back to the source, resulting in child nodes as early as V2 being informed that this piece of news is not true. In both cases, misinformation could not continue to expand and the combination of the last two variables suggests it significantly halted the expansion. Finally, both simulations suggests that the size of the population may not be a relevant factor if an accessible authentication tool is provided. Therefore in answering the research questions set out in this paper, the authors conclude:
The results show that the spread of misinformation and the effective use of the “right-click authenticate” button is further proven to be effective using three-dimensional simulation.
The outcomes of the three-dimensional simulation of misinformation and use of the “right-click authenticate” button are proved to be consistent with outcomes of the two-dimensional simulation.
Fig. 10. Two dimensional[14] versus three dimensional simulation results
Although the three-dimensional simulations have been successful in visualizing how misinformation travels in the real-life, the authors had to make many assumptions regarding the values provided to key variables. The assumptions the authors made are mainly based on reflective analysis subjective to individual experiences of the authors and representing online one speculative scenario. It is worth noting though that this approach is comparable to similar research on modelling the travel of misinformation. Moreover, the authors acknowledge that further research should be conducted to investigate the effect of more potential variables on the travel of information and means of combating misinformation online. And where possible, more accurate data needs to be collected on the average values associated with the variables identified in their studies.